Analytics and insights
Analytics show patterns in how sensitive data moves through your organization's applications. You see aggregate numbers, not individual texts or users.
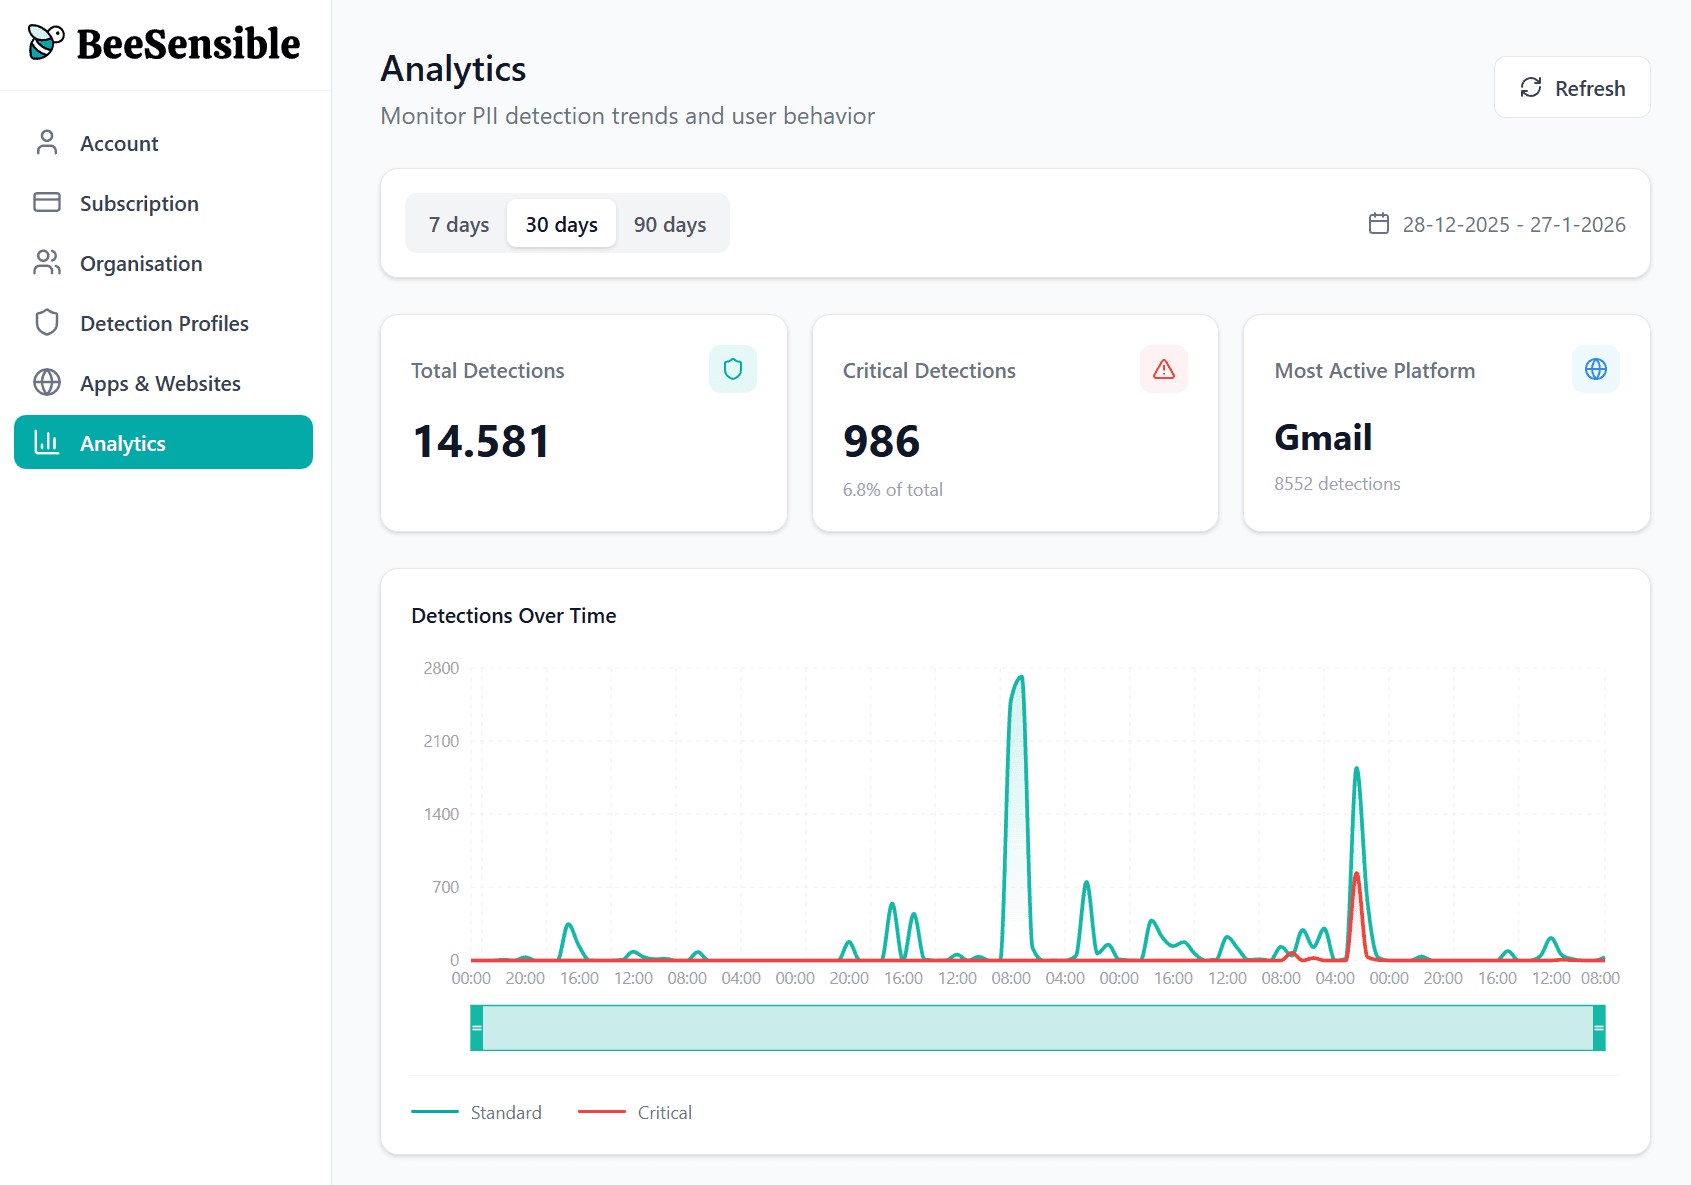
Overview metrics
Key numbers for your selected time period:
Total detections — How many times sensitive data was highlighted
Critical detections — How many of those were red highlights
Top application — Where most detections occurred
Active users — How many people had at least one detection
Timeline
A chart shows detections per day, split by standard and critical. Look for:
Spikes — Might indicate a busy project or something worth investigating
Trends — Are detections increasing or decreasing over time?
Patterns — Regular weekly cycles, end-of-month increases
Breakdowns
View detections by:
Application — Which tools generate the most highlights?
Data type — Mostly names? Financial data? Credentials?
Action taken — How often do people remove, replace, mask, or ignore?
What analytics tell you
A team with many critical detections that stay unaddressed might need additional training. A team that consistently masks data before using AI tools has internalized the practice.
Analytics help you identify where practices align with policy and where they diverge. They're a management tool, not a surveillance tool.
Privacy safeguard
To prevent individual identification, analytics require at least 10 active users in a group before displaying data. Smaller teams see only organization-level numbers.